The SocialGlass system
SocialGlass is a web-based system that enables and facilitates the integration of heterogeneous and dynamic geo-social data. The system provides a user-friendly and grafical user interface to methods of data visualisation and exploratory analysis, at various spatial and temporal scales.
The SocialGlass system combines data from several geo-enabled social media (e.g. Twitter, Instagram, and even Sina Weibo) and LBSNs (e.g. Foursquare), publicly available urban data from governmental portals, and various sensor feeds. It further provides mechanisms for the incorporation of custom data sources.
System architecture
The system relies upon a modular architecture. The basic idea is that different tasks are assigned to different software modules. In turn, the functionality performed by each modules determines its connection patterns; that is, the other modules that it directly communicates with. The inter-module communication is achieved by means of message queues. This means that each module receives information from related ones (e.g. modules that perform certain tasks pertinent to a particular process) in the form of messages. Then, after processing the received message, it may also send messages to other modules that expect this information to complete a certain procedure. In this way, the system can be quite easily extended with new modules, without posing significant challenges to the already existing structure and system functionality.
The various modules that comprise the system are organised into four main components, namely:
To get a better understanding of the system architecture, you may have a look here and here.
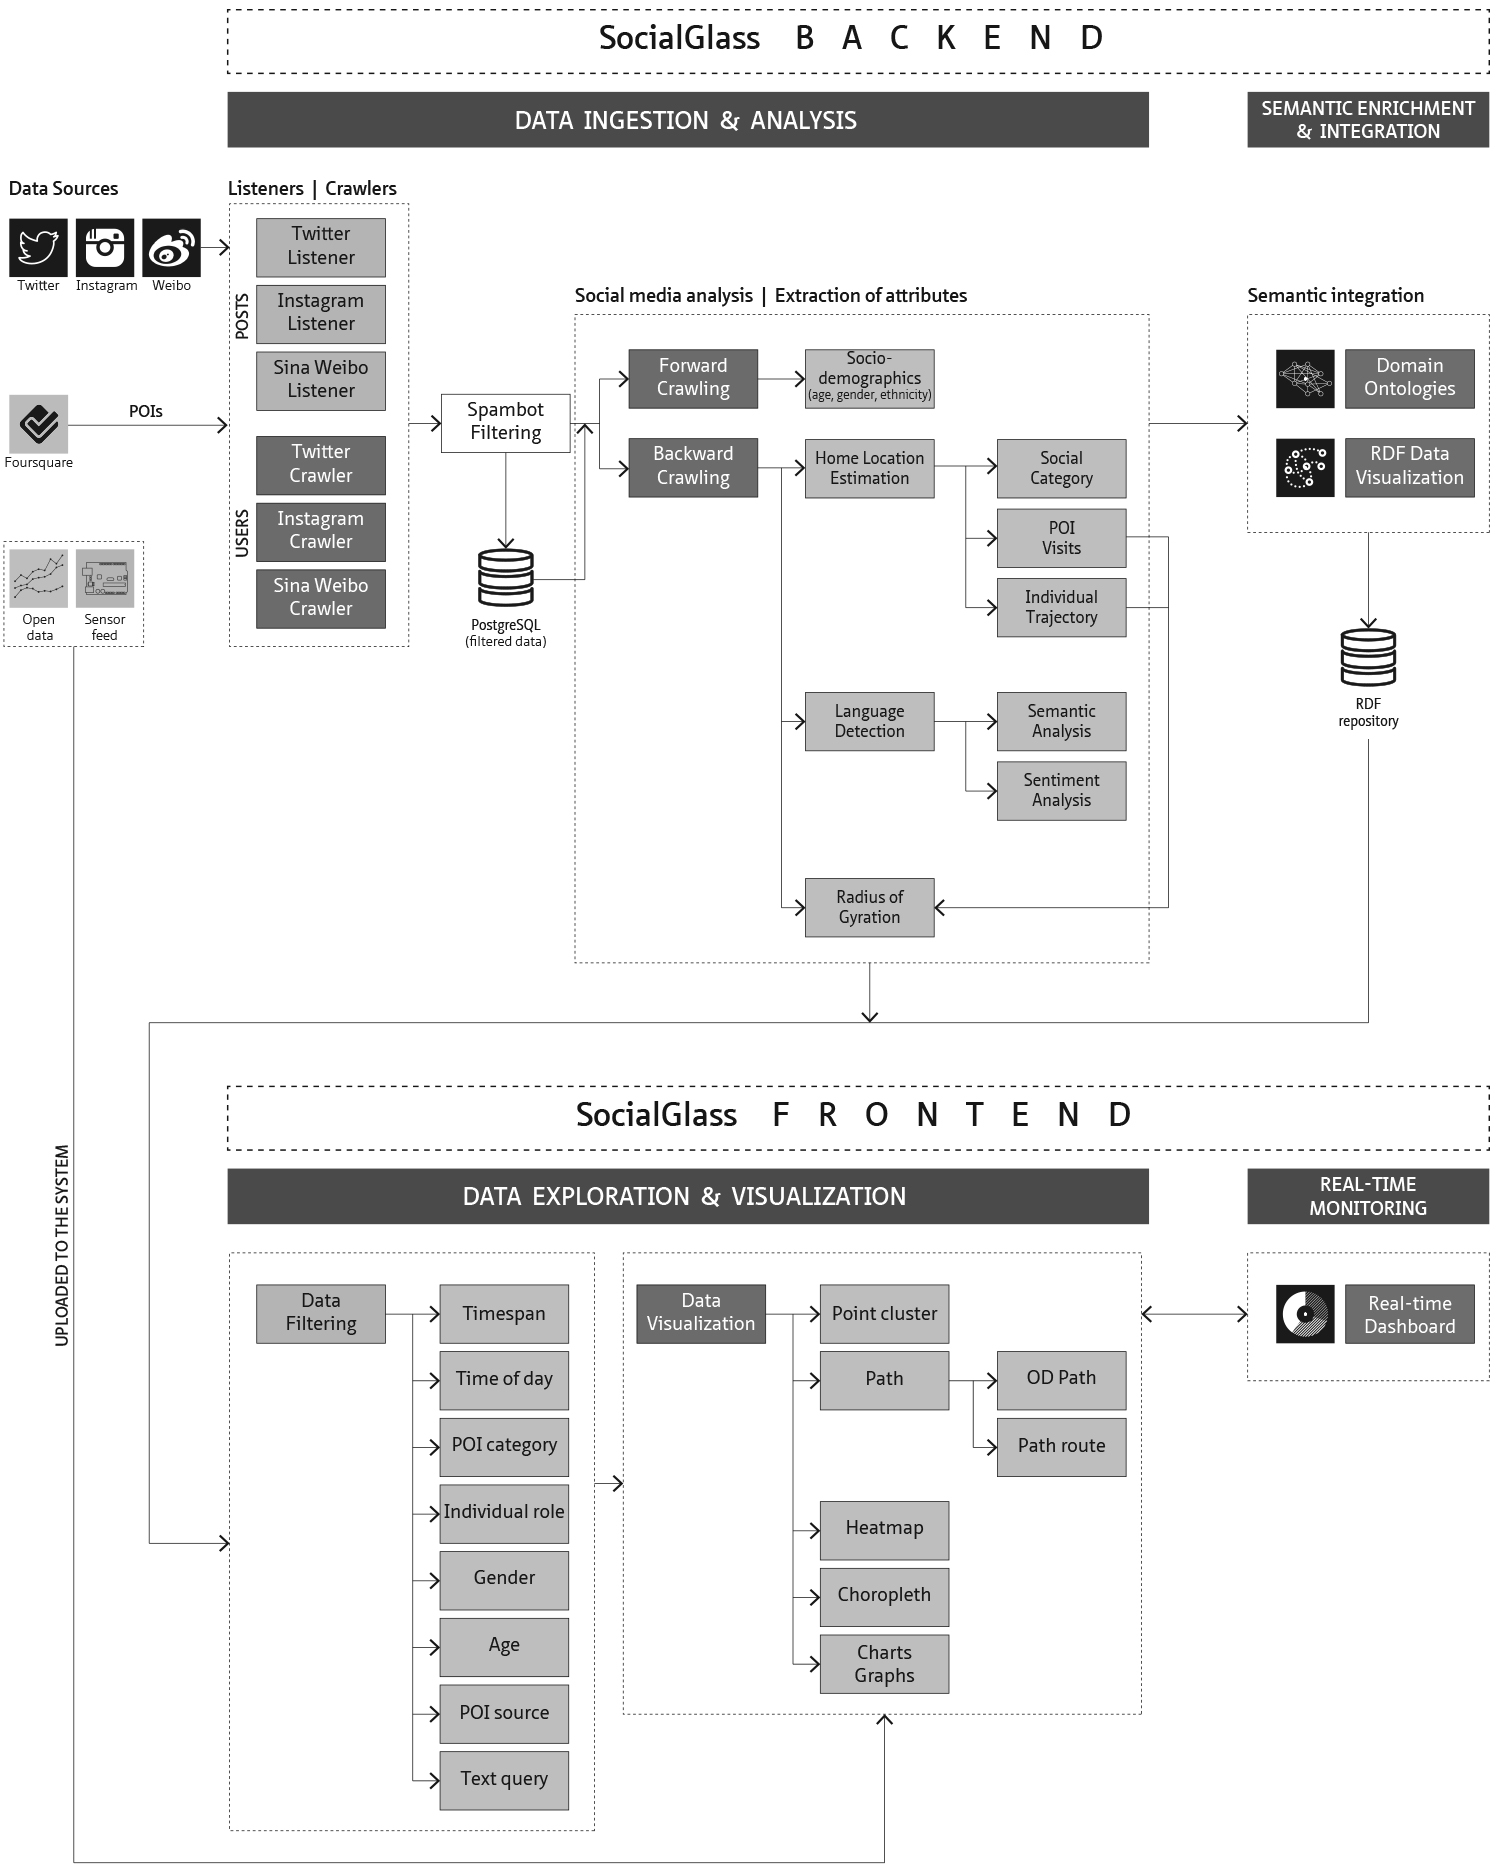
The system architecture of SocialGlass. Click on the image to enlarage it.
The system comprises several modules that extract, infer, and model characteristics of the users’ demographics and social activity. Examples include the classification of users into residents, commuters, and foreign visitors (based on the inferred home location), the inference of their age range and gender, the calculation of each individual’s radius of gyration, as well as topical and sentiment analysis of their activity.
Data visualisation
The frontend of the system provides several interactive visualisation tools. These include:
In addition, it provides several data filters that enable the classification of data by source, geodemographic category, time span, time frame within a day, POI category, age range, and gender type, while also allowing for text filtering.
The images below provide indicative illustrations of the SocialGlass user interface (click on the images to enlarge them).
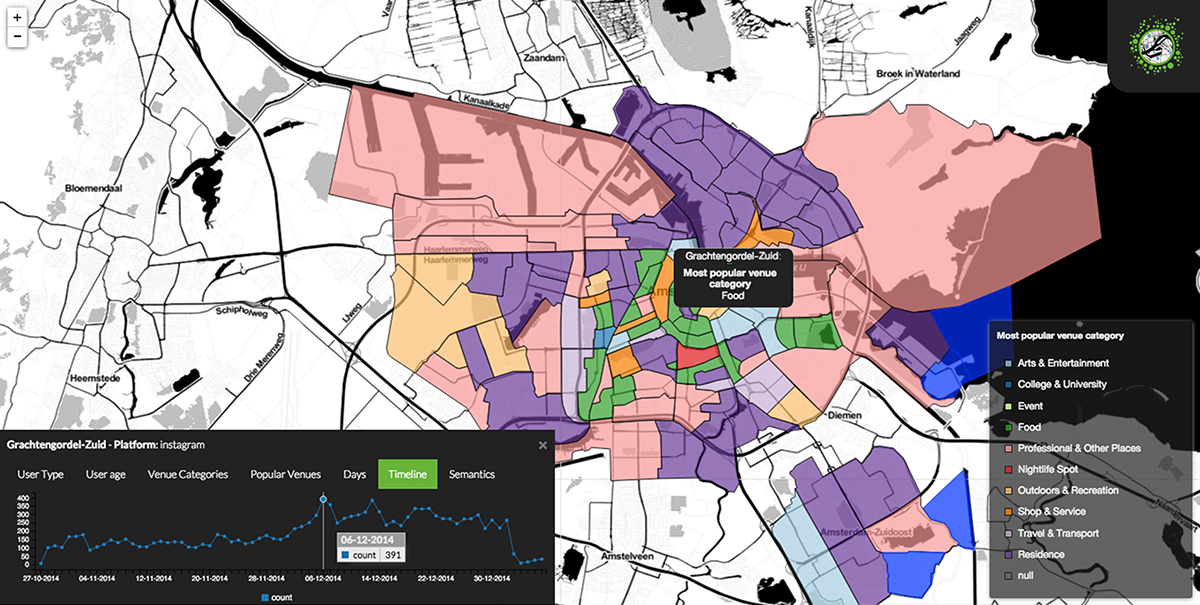
Choropleth map of prevalent social activities, as inferred from Instagram

Amsterdam – Flows of residents during SAIL2015

Activity patterns of Amsterdam residents during the Amsterdam Light Festival 2015