SocialGlass
  • HOME
  • ABOUT
    • SocialGlass Platform
    • Team
    • Contact
  • BLOG
    • News
    • Tutorials
    • Events
  • RESEARCH
    • Projects
    • Publications
Select Page
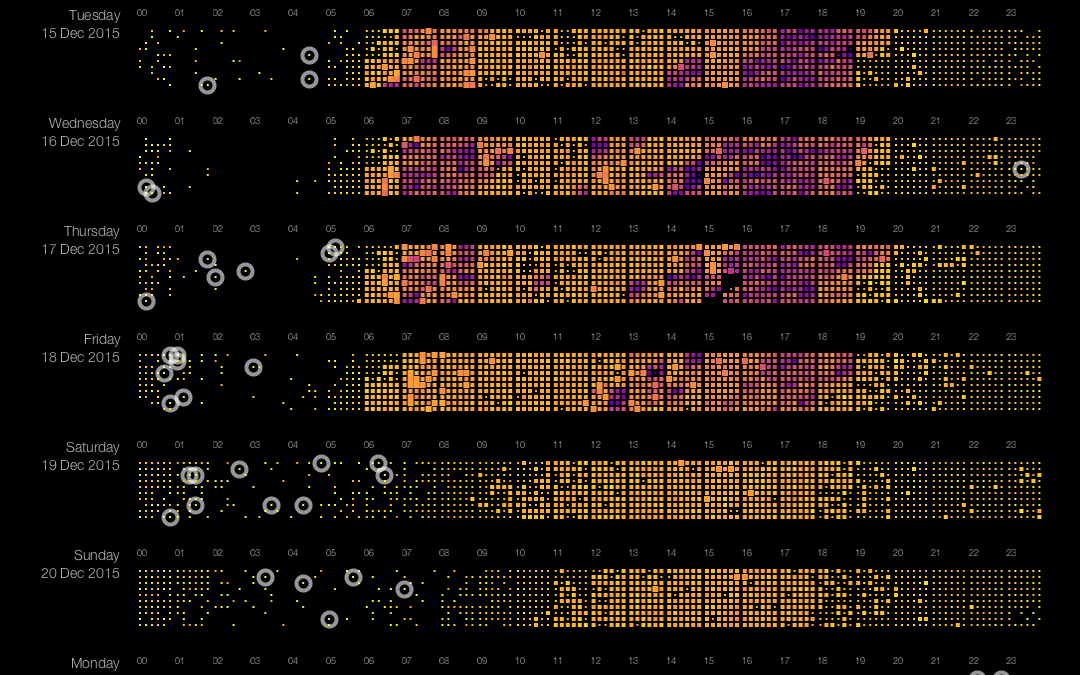
Pixel-based visualization of traffic data – part 1/3

Pixel-based visualization of traffic data – part 1/3

by Erik Boertjes | Jul 25, 2017 | Tutorials

Introduction The topic of mobility has always been high on the agenda of the Dutch Government. It is vital for the Dutch economy that our roads allow goods and people to flow freely from harbour to client, from home to work, from friends to soccer fields, preferably...

Recent Posts

  • VACANCY Postdoc Social Data Analytics to Support Vulnerable Youth
  • AMS Seminar on Urban Data Science
  • Dr Achilleas Psyllidis gave an invited lecture at the Smart City Conference 2017
  • Pixel-based visualization of traffic data – part 3/3
  • Alessandro Bozzon selected for IBM 2017 Faculty Award

Recent Comments

  • Pixel-based visualization of traffic data – part 1/3 | SocialGlass on Pixel-based visualization of traffic data – part 2/3

Archives

  • November 2017
  • October 2017
  • September 2017
  • August 2017
  • July 2017
  • June 2017
  • May 2017
  • February 2017

Categories

  • Event
  • Highlights
  • News
  • Tutorials

Meta

  • Log in
  • Entries feed
  • Comments feed
  • WordPress.org
  • Twitter
  • RSS
© 2017 SocialGlass